Dataspace
The Dataspace View provides a spreadsheet-like interface. You can prepare, organize, calculate, and manage all data in Dashboardx just like using Excel, WPS Spreadsheets. To help beginners get started quickly, this chapter provides an overview of basic operations in the dataspace. If you already have rich experience using spreadsheets and are proficient in managing data with spreadsheets, you can directly jump to Creating Datasets.
Data Sources
Copy from spreadsheet applications or create directly
The dataspace currently only supports copying data from spreadsheet applications such as Excel, WPS, Numbers, Google Sheets, and pasting it into the designer. This is the fastest and most flexible data import method. Of course, you can also directly create and manage data in the dataspace, with operations completely consistent with the spreadsheet applications you are familiar with.
Pasting Data from Clipboard
- Select data area in the source spreadsheet application (can include header row)
- Copy (
⌘C) - Switch to data perspective in the dataspace or directly open the dataspace view
- Right-click after selecting a cell to activate context menu for pasting or directly use shortcut
⌘V
💡 Tip
When pasting, the system automatically recognizes separators (such as tabs, commas) and attempts to infer the data type of each column (text, numbers, dates, etc.). Pasted data immediately becomes an editable table.
Data Area Specifications
- The first row can serve as column headers (recommended), while also supporting the first column as row headers.
- Supports multi-row headers (can be manually adjusted after pasting).
- Cell content supports text, numbers, dates, logical values.
⚠️ Note
Currently, directly opening files (such as .xlsx/.csv) or connecting to databases is not supported. All data needs to enter the system via the clipboard.
Spreadsheet-style Data Interface
Dashboardx's data management interface completely mimics Excel/WPS spreadsheets, so you'll feel very familiar.
Interface Layout
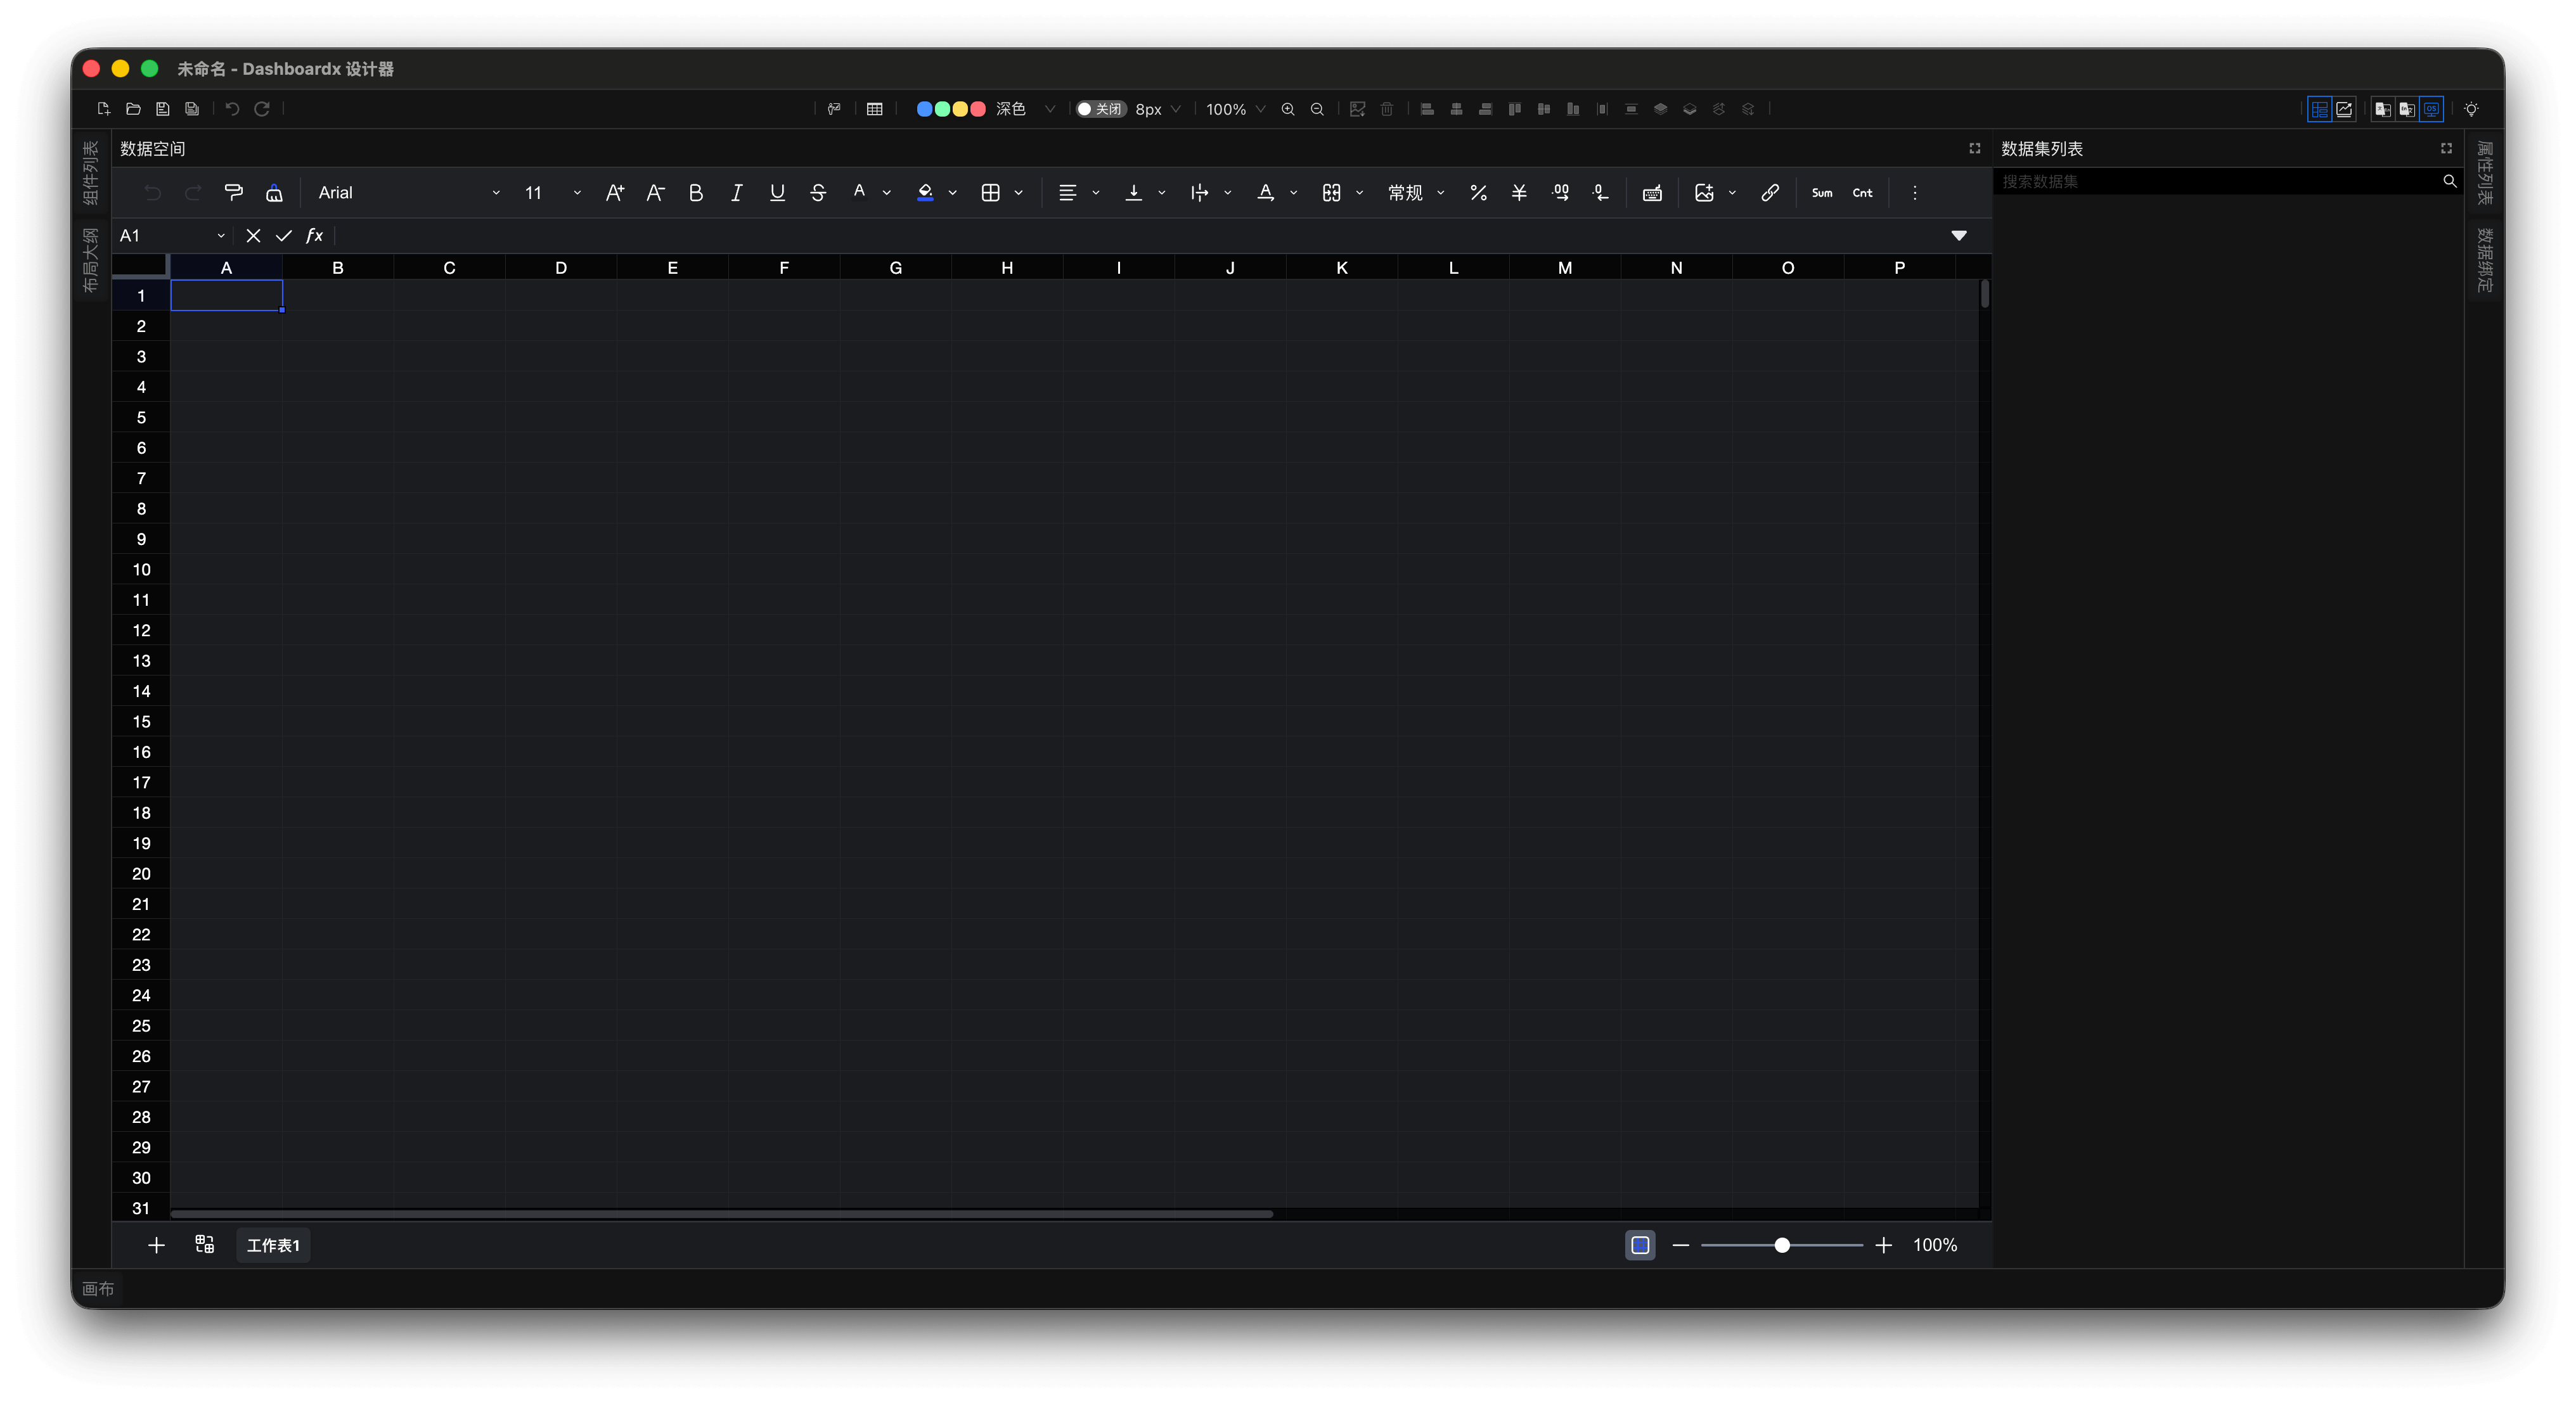
Figure 1: Dataspace View
- Toolbar: Provides all the tool options needed for table operations.
- Formula Bar: Exactly the same as spreadsheet application formula bars, allowing formula input and editing.
- Cells: Double-click to enter edit mode, supports input of formulas, text, numbers.
- Context Menu: Right-click column header to insert/delete/rename/copy columns; right-click row number to insert/delete rows.
💡 Tip
The dataspace view has its own independent toolbar for ease of use.
Basic Table Operations
| Operation | Method |
|---|---|
| Select Column | Click column header |
| Select Row | Click row number |
| Insert Column | Right-click → Insert Column |
| Insert Row | Right-click → Insert Row |
| Delete Column | Right-click → Delete Column |
| Delete Row | Right-click → Delete Row |
| Move Column | Drag column header |
| Move Row | Drag row number |
| Resize Column | Drag column border |
| Resize Row | Drag row border |
| Freeze Panes | View → Freeze Panes |
| Sort Data | Right-click → Sort |
| Multi-select | Shift for continuous, ^ for discontinuous |
| Find & Replace | ⌘F |
| Undo/Redo | ⌘Z / ⌘Y |
Data Editing
- Direct Editing: Double-click any cell or press
F2to edit directly - Formula Bar: Enter formulas in the formula bar at the top
- Fill Handle: Drag the fill handle in the lower-right corner of a cell to copy formulas or data
- Find & Replace:
⌘Fto find,⌘Hto replace - Undo/Redo:
⌘Z/⌘⇧Z
💡 Tip
The dataspace view has its own independent toolbar for ease of use.
Formatting Cells
Data Types
| Type | Description | Example Format |
|---|---|---|
| Text | General text, identifiers, codes | Product Name, ID |
| Number | Numeric values, calculations | 12345, 99.99 |
| Percentage | Percentage values | 15%, 0.25 |
| Currency | Monetary amounts | $1,234.56, ¥100 |
| Date | Dates | 2024-01-15 |
| Time | Times | 14:30:00 |
| DateTime | Combined date and time | 2024-01-15 14:30 |
| Boolean | Logical values (TRUE/FALSE) | TRUE, FALSE |
Number Formatting
- Decimal Places: Set precision for numeric values
- Thousands Separator: Add comma separators for large numbers
- Negative Numbers: Red color or parentheses formatting
- Scientific Notation: Display very large or small numbers
Text Formatting
- Font: Family, size, style (bold, italic, underline)
- Alignment: Horizontal and vertical alignment
- Text Wrap: Automatically wrap text within cells
- Merge Cells: Combine multiple cells into one
💡 Tip
Proper formatting not only improves readability but also helps Dashboardx better infer data types and chart recommendations.
Data Cleaning and Transformation
Common Data Issues and Handling
| Issue | Handling Within Table |
|---|---|
| Blank Cells | Select and directly input values; or use formula =IF(ISBLANK(A1), 0, A1) |
| Text-formatted Numbers | Create new column, use formula =VALUE([Original Column]) |
| Leading/Trailing Spaces | Create new column, use formula =TRIM([Original Column]) |
| Inconsistent Date Formats | Use =DATEVALUE() or =TEXT() to unify formats |
Commonly Used Cleaning Functions
-- Text Cleaning
=TRIM([Address])
=UPPER([City])
=PROPER([Name])

-- Number Conversion
=VALUE([Text Number])
=ROUND([Unit Price], 2)

-- Date Processing
=DATEVALUE("2026/2/12")
=YEAR([Order Date])
=TEXT([Order Date], "yyyy-mm-dd")

-- Error Handling
=IFERROR([Original Formula], "To be filled")
Calculation Fields and Formulas
The dataspace supports Excel-style formula language, currently covering over 500 formulas. You can refer to the Appendix for the complete formula list. The following provides a brief introduction to some commonly used formulas. The dataspace supports referencing cell content through cell positions, such as A1, A1:A10, etc., and also supports obtaining references through custom names. We recommend using custom names to obtain references, so that when the reference range is updated, we only need to update the custom name. The custom name interface in the dataspace is shown in the figure:
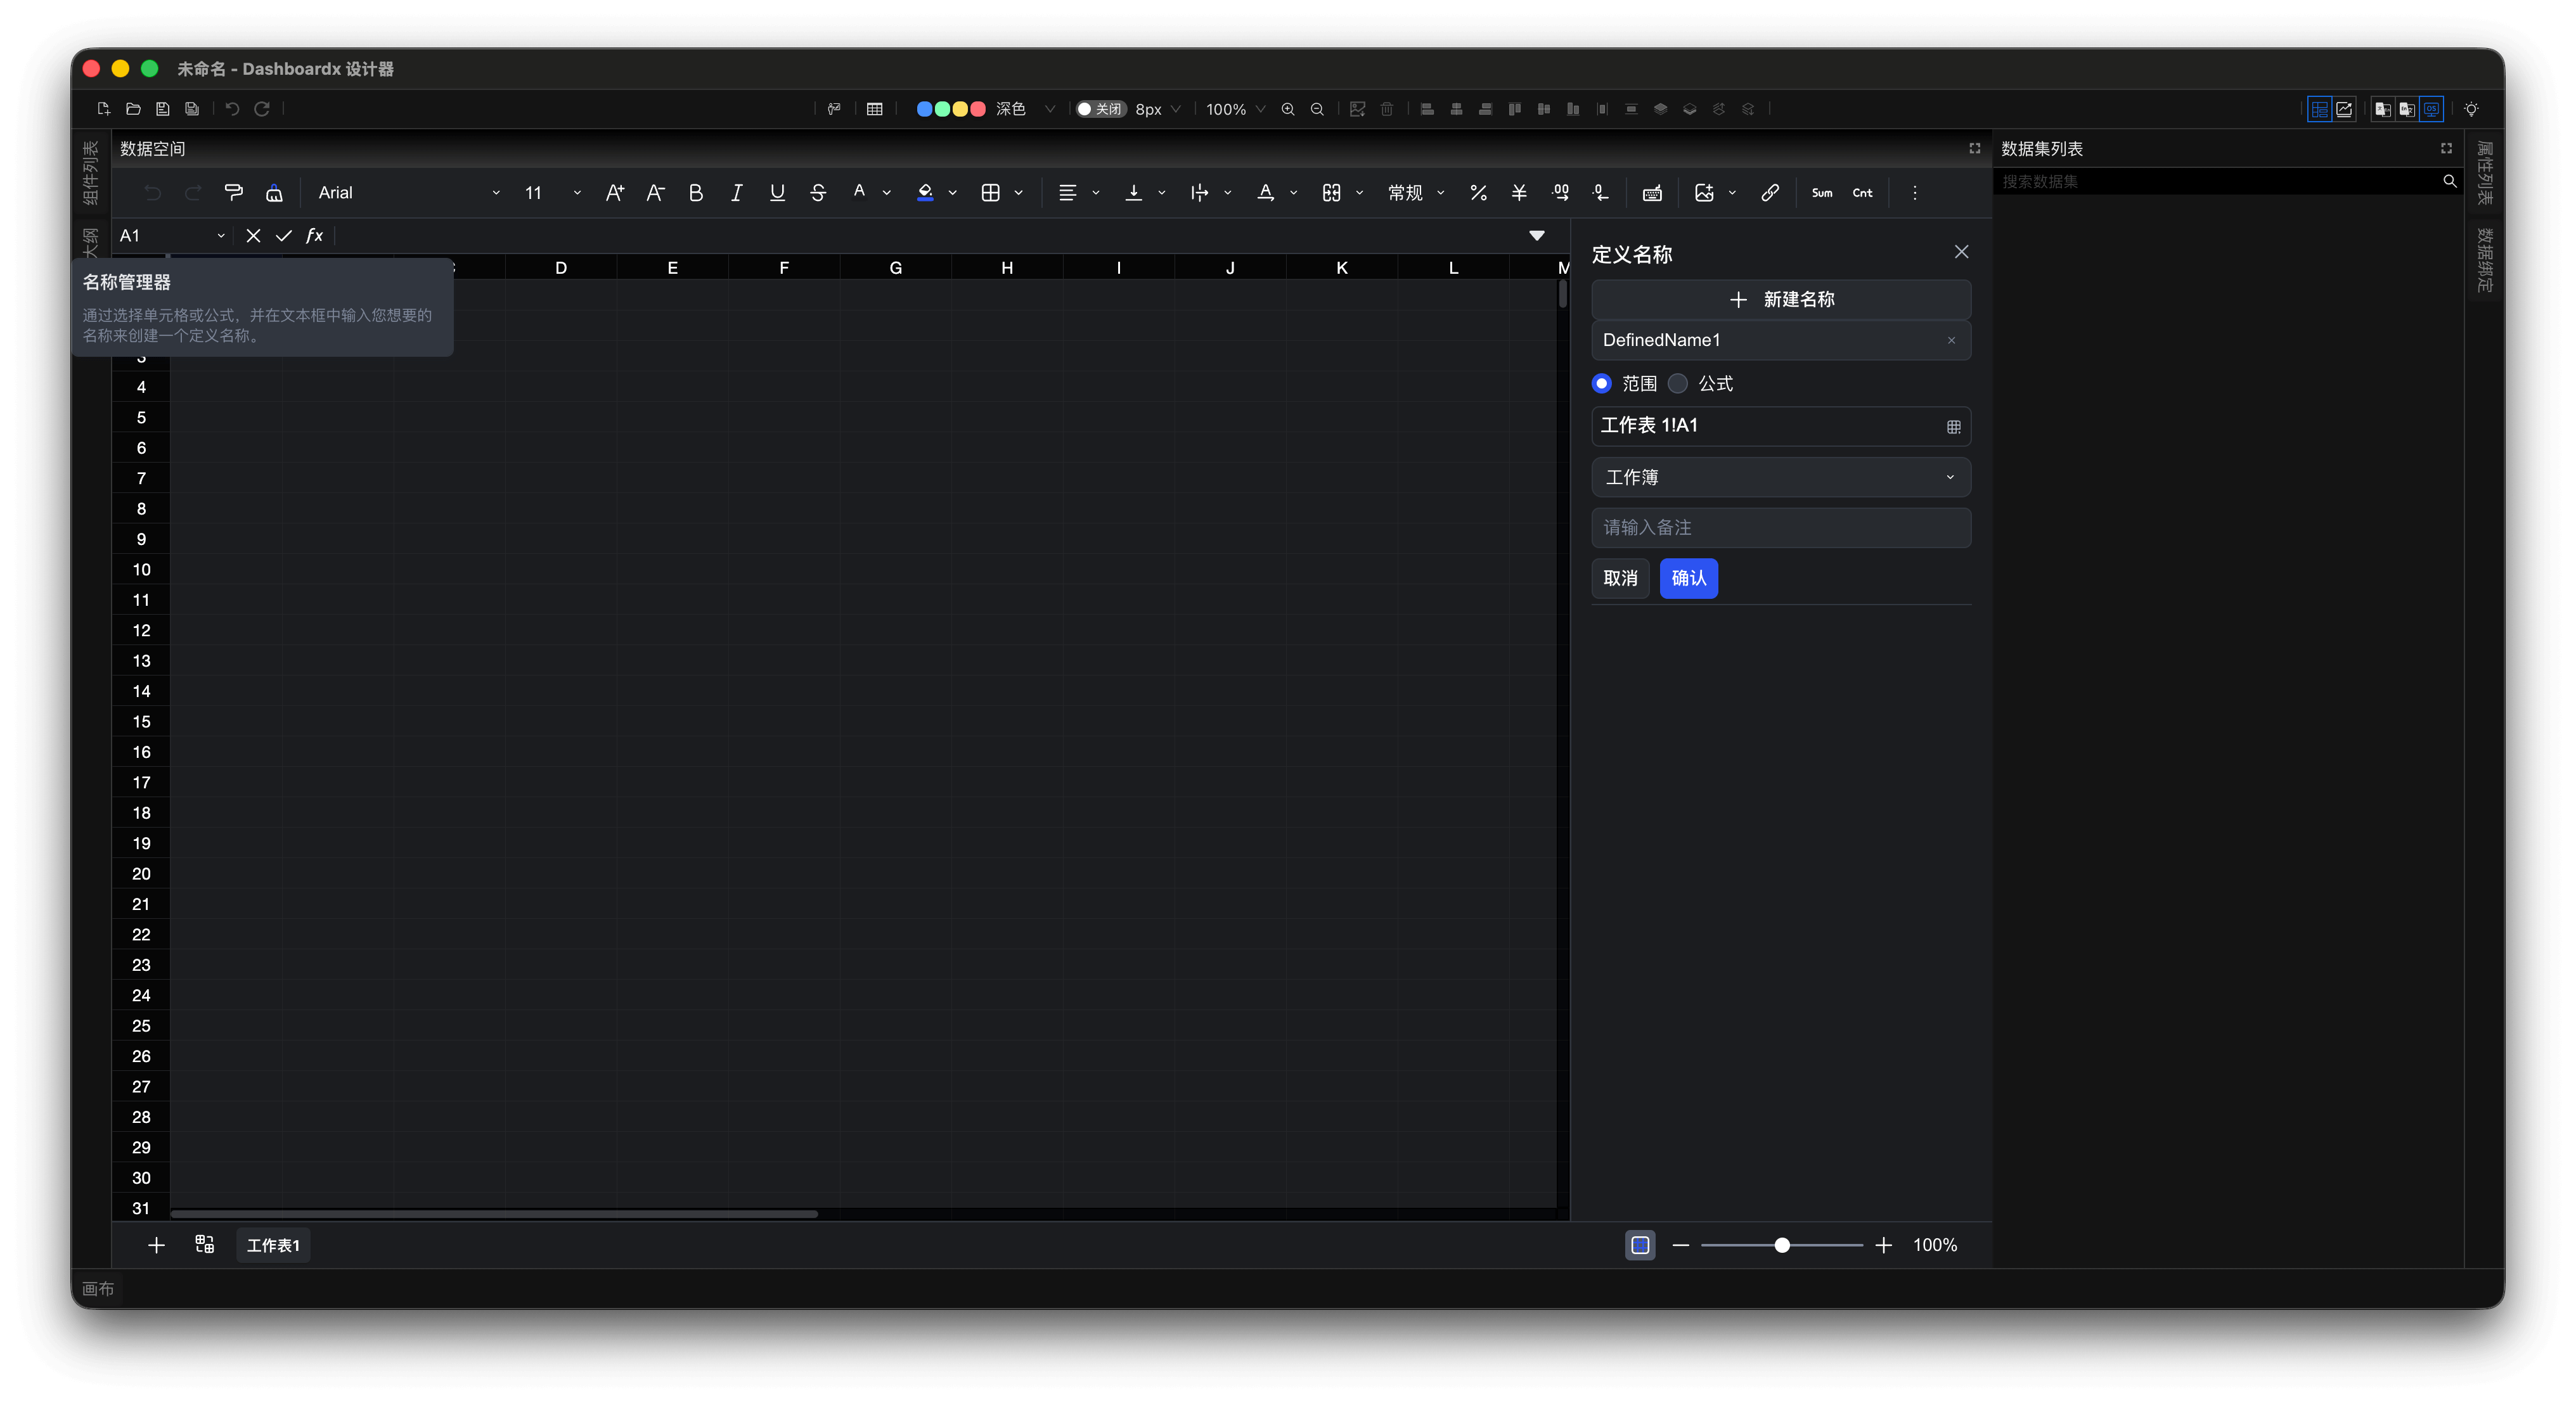
Figure 2: Custom Name Interface
Commonly Used Formula Categories
1. Mathematical Functions
- Basic Operations:
SUM,AVERAGE,MAX,MIN,COUNT - Rounding:
ROUND,ROUNDUP,ROUNDDOWN,INT,TRUNC - Trigonometry:
SIN,COS,TAN,PI,RADIANS,DEGREES - Logarithms:
LOG,LOG10,LN,EXP - Random Numbers:
RAND,RANDBETWEEN
2. Statistical Functions
- Descriptive Statistics:
STDEV,VAR,MEDIAN,MODE - Ranking:
RANK,PERCENTILE,QUARTILE - Distribution:
NORM.DIST,T.DIST,CHISQ.DIST
3. Text Functions
- Concatenation:
CONCAT,TEXTJOIN - Extraction:
LEFT,RIGHT,MID,FIND,SEARCH - Transformation:
UPPER,LOWER,PROPER,TRIM,CLEAN - Conversion:
VALUE,TEXT,NUMBERVALUE
4. Date and Time Functions
- Current:
TODAY,NOW - Extraction:
YEAR,MONTH,DAY,HOUR,MINUTE,SECOND - Calculation:
DATE,TIME,DATEDIF,WORKDAY,NETWORKDAYS - Conversion:
DATEVALUE,TIMEVALUE
5. Logical Functions
- Conditions:
IF,IFS,SWITCH - Logical Tests:
AND,OR,NOT,XOR - Error Handling:
ISERROR,IFERROR,ISNA
6. Lookup and Reference Functions
- Lookup:
VLOOKUP,HLOOKUP,XLOOKUP - Indexing:
INDEX,MATCH - Reference:
OFFSET,INDIRECT
7. Financial Functions
- Basic:
PV,FV,PMT,RATE,NPER - Depreciation:
SLN,DB,DDB,VDB - Investment:
IRR,MIRR,NPV
💡 Tip
Performance Tip: Use XLOOKUP instead of VLOOKUP for better performance and flexibility.
Formula Examples by Category
Mathematical Operations
= [Quantity] * [Unit Price]
= [Sales] - [Cost]
= [Profit] / [Sales] * 100
= SUM([Sales])           -- Sum entire column
= AVERAGE([Unit Price])  -- Average of entire column
= MAX([Quantity])        -- Maximum value
= MIN([Quantity])        -- Minimum value
Conditional Judgment
= IF([Sales] > 10000, "High", "Low")
= IFS([Score] >= 90, "A", [Score] >= 80, "B", TRUE, "C")
= AND([Age] >= 18, [Age] <= 60)
= OR([Region] = "North", [Region] = "South")
Text Processing
= [LastName] & " " & [FirstName]
= LEFT([ProductCode], 2)
= MID([IDNumber], 7, 8)
= RIGHT([Email], LEN([Email]) - FIND("@", [Email]))
= LEN([Notes])
= FIND("Province", [Address])
= SUBSTITUTE([Phone], "-", "")
Date and Time
= TODAY()
= NOW()
= YEAR([Birthday])
= MONTH([OrderDate])
= DAY([OrderDate])
= WEEKDAY([Date], 2)        -- Monday as 1
= DATEDIF([Start], [End], "d")
= [EndDate] - [StartDate]   -- Day difference
= EDATE([ContractDate], 12) -- One year later
= EOMONTH([Date], 0)       -- End of month
Lookup and Reference
-- Lookup from other areas in the same worksheet (need to use absolute references or table names)
= VLOOKUP([ProductID], $A$1:$C$100, 2, FALSE)
= XLOOKUP([CustomerID], [CustomerID], [Name])
Statistical Functions
= COUNT([OrderNumber])          -- Count of numeric cells
= COUNTA([Notes])               -- Count of non-empty cells
= COUNTBLANK([Notes])           -- Count of empty cells
= COUNTIF([Region], "North")
= SUMIF([Region], "North", [Sales])
= AVERAGEIF([Product], "*Keyboard*", [UnitPrice])
= SUMIFS([Sales], [Region], "North", [Year], 2025)
Formula Best Practices
1. Use Named Ranges
=SUM(Sales_Data)  // Good: Using named range
=SUM(A1:A100)     // Less ideal: Using cell references
2. Avoid Volatile Functions When Possible
=TODAY()          // Volatile: Updates every day
=DATE(2024,1,15)  // Non-volatile: Fixed date
3. Use Array Formulas Wisely
=SUMIFS(Sales, Region, "East", Product, "Widget")
// More efficient than complex array formulas
4. Document Complex Formulas
=IFERROR(
  VLOOKUP(A2, Price_List, 2, FALSE),
  "Price not found"
) // Looks up product price, returns error message if not found
One-to-Many Association (Return First Match)
-- Add "Latest Order Amount" column to customer table
= XLOOKUP([CustomerID], [OrderTable.CustomerID], [OrderTable.Amount], , 0, -1)  -- Search from back to front
Multi-condition Association
-- Create composite key using helper column
= [ProductID] & "-" & [Region]
= XLOOKUP([CompositeKey], [PriceTable.CompositeKey], [PriceTable.Price])
⚠️ Note
The current version does not support pivot tables or Power Query. All data associations must be completed through formulas between worksheets.
📌 Core Formula Solutions
| Requirement | Formula Solution |
|---|---|
| Summarize values by dimension | SUMIFS + UNIQUE + helper column |
| Multi-condition counting | COUNTIFS |
| Calculate proportion | Summary value / total (total locked with SUM) |
| Distinct list | UNIQUE |
| Multi-table association | XLOOKUP / INDEX+MATCH / SUMIFS cross-table |
Creating Datasets
In the Quick Start section we have already introduced how to create datasets. Currently, dataset creation is supported through the global toolbar or application menu.
The dataset creation dialog requires the following information:
- Name: It is recommended that dataset names reflect which worksheet they are in for easy subsequent lookup. For example, if you select annual population data in the worksheet
Population Census, you can name itPopulation Census!Annual Population Data. - Field Provision Method: Dashboardx Designer supports providing data either column-based or row-based, and all components that support data binding support both methods. It is recommended to choose column-based field data provision as much as possible, as this better aligns with usage habits in most scenarios.
💡 Tip
- The shortcut key for creating datasets is ⌘D. Under the premise of selecting table data that needs to create a dataset, using this shortcut key can conveniently create datasets.
- Components have specification requirements for dataset fields. Dashboardx Designer provides dataset examples that all components can bind in the "Component Example Templates". You can determine how to organize dataset fields to meet component requirements through these examples.
Updating or Deleting Datasets
Created datasets are displayed in the dataset list panel. For all supported operations, please refer to Datasets.
⚠️ Note
If a dataset has expansion or deletion needs in rows or columns, it is recommended that one dataset occupies one worksheet, so it won't have additional side effects on other data. If this cannot be done, the second-best option is to keep the right and bottom of the dataset empty.
Performance Optimization
Since data is completely processed in memory in spreadsheet form, please follow these best practices:
✅ Recommended Practices
- Map data regions as custom names: After updating the associated range in custom names, formulas automatically expand, avoiding the issue of modifying cell indices everywhere.
- Avoid whole column references:
SUM(A:A)calculates all rows, it is recommended to use explicit range references, such asSUM(A1:A1000). - Reduce use of volatile functions:
TODAY(),NOW(),RAND(),OFFSET(),INDIRECT()trigger recalculation every time you edit. - Decompose complex formulas: Use helper columns, each column completes a single task, easy to debug and maintain.
- Use
LETfunction (Excel 365 style) to define intermediate variables, avoiding repeated calculations.vb=LET(OriginalPrice, [UnitPrice]*[Quantity], Discount, IF([Quantity]>100, 0.1, 0.05), OriginalPrice*(1-Discount))
❌ Should Avoid
- Extensive use of conditional formatting: Significantly reduces scrolling performance.
- Cross-table whole column references: For example
CustomerTable!A:A.
Troubleshooting Common Issues
Issue 1: After pasting data, dates turn into number strings?
Answer: These are Excel's serial values. Select the column, use "Format" menu → Set as date format, or convert via formula: =TEXT(A2, "yyyy-mm-dd").
Issue 2: Formula returns #NAME?
Answer: Indicates incorrect spelling of function name or incorrect column name reference in the formula. Check if column names contain spaces (need to be enclosed in square brackets, such as [Order ID]).
Issue 3: XLOOKUP returns #N/A
Answer: No matching item found. Can nest IFERROR: =IFERROR(XLOOKUP(...), "None").
Summary
Dashboardx Designer's data management module is not a database management tool, but a lightweight yet powerful spreadsheet environment. You just need to:
- Copy data from Excel/WPS spreadsheets → Paste into the designer.
- Clean, calculate, associate data like operating Excel/WPS spreadsheets.
- Directly use column data or row data to create datasets, then build visual dashboards.
All data processing is completed in the grid interface you are familiar with, no need to learn SQL, no need to configure data sources, no need to wait for import/export. This allows you to focus 100% of your energy on data analysis and dashboard design.
The best data tool is the one you already know how to use. Dashboardx Designer's dataspace seamlessly connects the flexibility of spreadsheets with the visualization capabilities of dashboards.
Wishing you pleasant data processing! 📊
Appendix
The dataspace supports over 500 Excel-style formulas, including all commonly used mathematical, statistical, text, date, logical, lookup, and financial functions. For the complete formula list, please refer to the official Excel documentation or use the formula help within Dashboardx Designer.
The data management module of Dashboardx Designer is not a database management tool, but a lightweight yet powerful spreadsheet environment. You just need to:
- Copy data from Excel/WPS spreadsheets → Paste into the designer.
- Clean, calculate, associate data like operating Excel/WPS spreadsheets.
- Directly use column data or row data to create datasets, then build visual dashboards.
All data processing is completed in the grid interface you are familiar with, no need to learn SQL, no need to configure data sources, no need to wait for import/export. This allows you to focus 100% of your energy on data analysis and dashboard design.